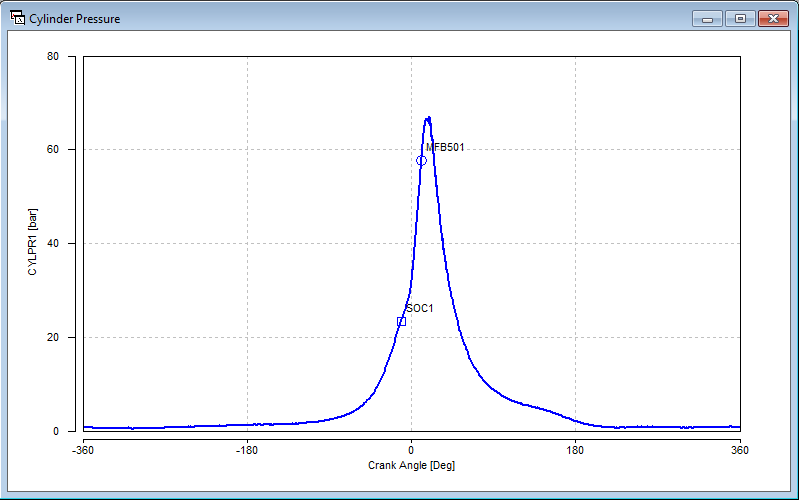
Crankangle Diagrams
Standard cylinder pressure crank angle diagram. The positions of Start of Combustion (SOC) and MFB50 identified on diagram.
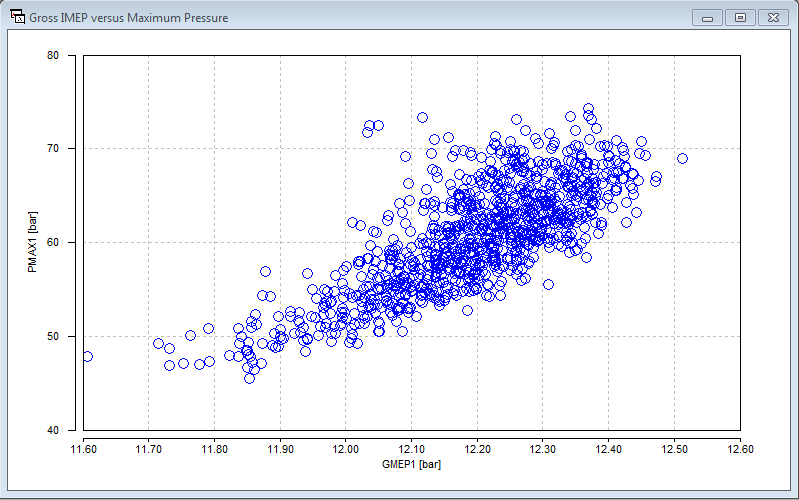
Scatter Plots
Gross IMEP (GMEP) plotted against Maximum Cylinder Pressure (PMAX). Moving the mouse cursor close to a point will identify the cycle number. Clicking on the point will change all crank angle plots to that cycle.
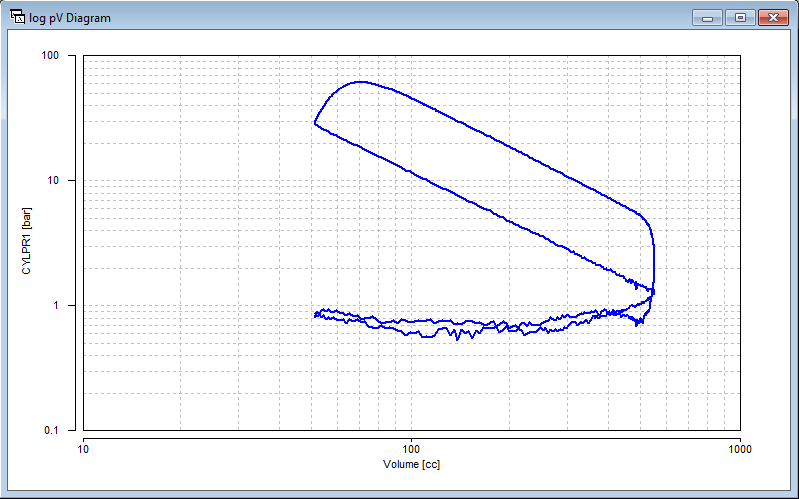
Log pV Diagram
X axis set as volume and both axes plotted with logarithmic scale
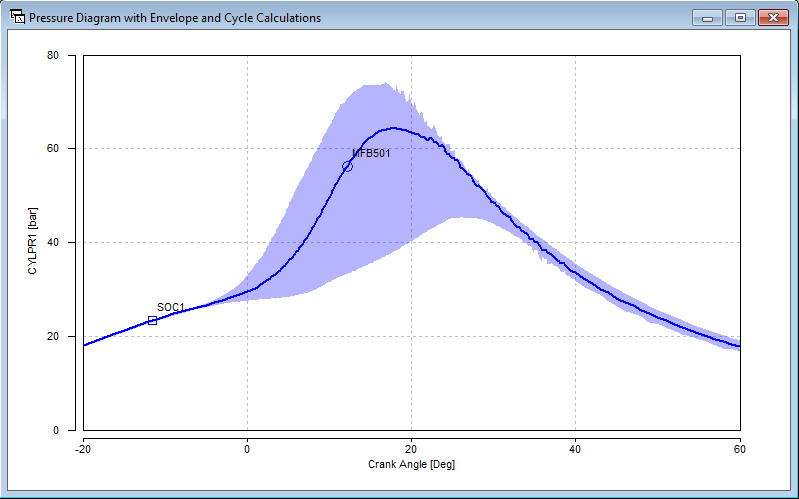
Data Envelope
Cylinder pressure plot with SOC and MFB50 again identified. The cylinder pressure envelope has been plotted to indicate the range of data. The envelope could also be from another data file so you can compare current combustion data to a reference condition.

Cyclic Data
Cycle peak knocking pressure. Note the cycle closest to the mouse pointer is highlighted in green. Clicking this point changes all crank angle plots to that cycle.
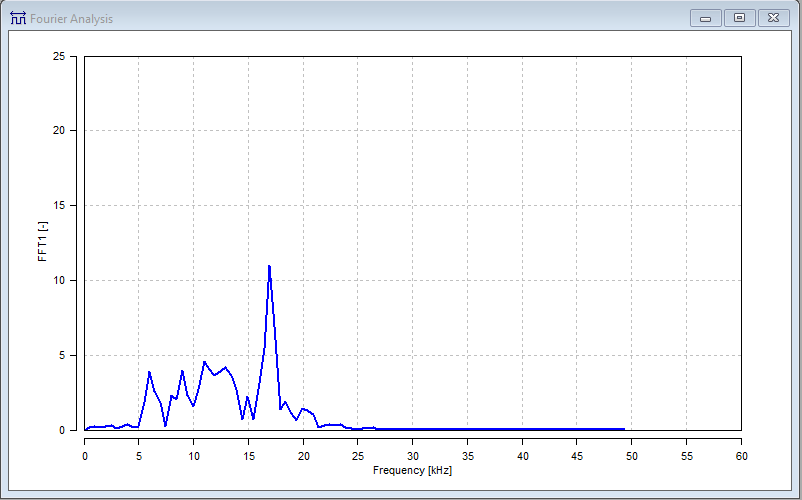
Fast Fourier Transform
Fourier analysis of knock sensor signal to determine knock control centre frequencies
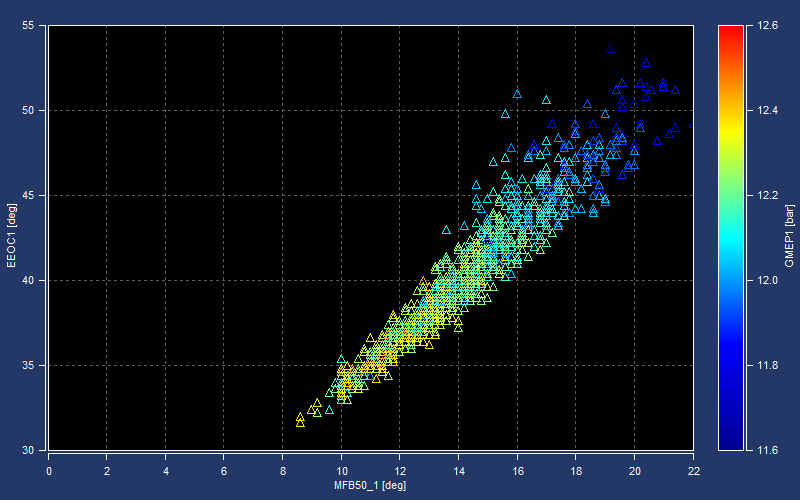
Pseudo 3D Diagrams
Pseudo 3D plot of MFB50 versus Estimate End of Combustion. Marker colour is colour map of GMEP. Diagram style of AVL Blue (IndiCom)
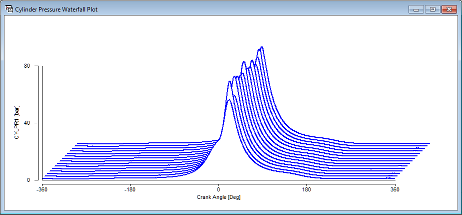
Waterfall Plots
Cylinder pressure plot in waterfall style showing current and previous fifteen cycles.

Cursors & Legends
Cursor and legend for instant measurements. Diagram in MATLAB R2014b onwards style

Data Lists
Datalist of current cycle calculations including minimum, maximum, mean and standard deviation statistics.
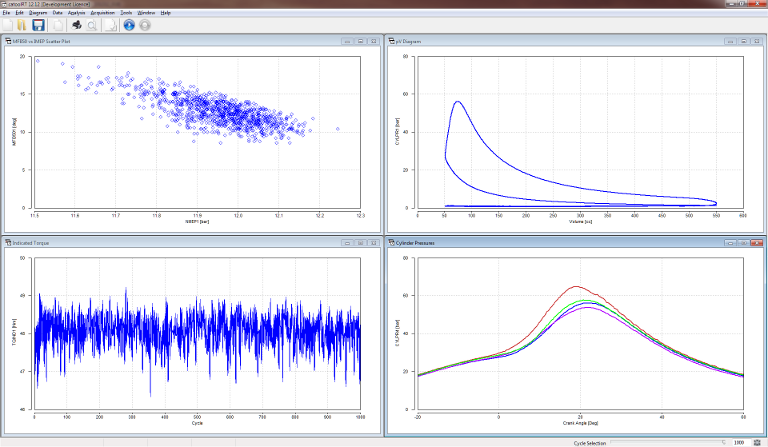
Multiple Diagrams
The catoolRT window can contain any number of user configured diagrams for real time monitoring or analysis of recorded data.
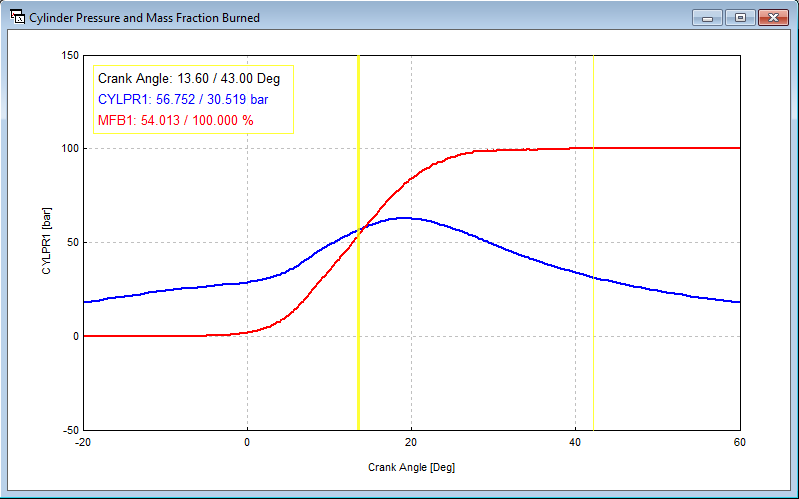
Multiple Channels
Cylinder pressure and Mass Fraction Burned (MFB) plotted on same axes. Cursors enable easy determination of values. Plot is in the alternate "MATLAB" style.
Invert Colours
All plots are easily inverted between black or white background depending on your viewing preference.

Waterfall FFT
Waterfall plot of knock sensor FFT. Diagram style of LabVIEW
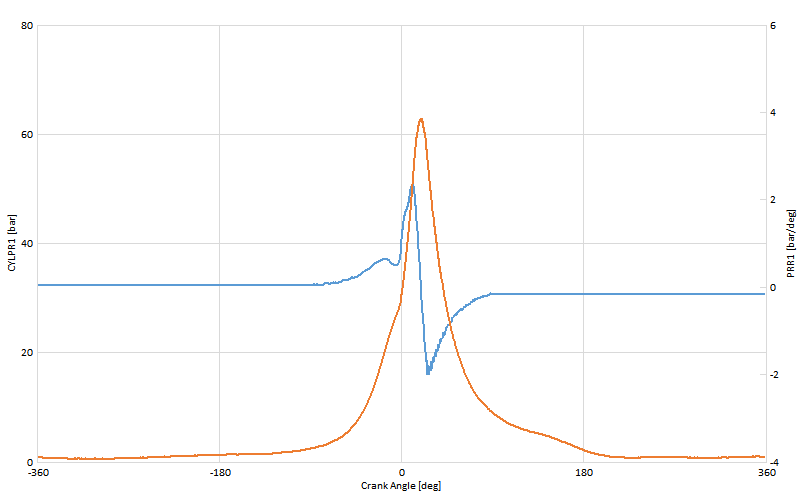
Two Axes
Two axes enables plots of varying scales. Diagram in Excel 2013 style
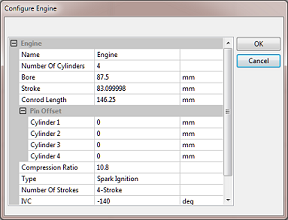
Engine Configuration
The engine geometry and type is fully configurable. catoolRT supports spark and compression ignition, 2 and 4 stroke cycles and any number of cylinders.

Analysis Configuration
The types of analysis performed in real time can be configured to reduce processor loading. The number of cycles that can be acquired is limited only by system memory.

CANbus Input
Acquire CANbus channels on a cyclic basis. Signals can be defined using CANdb++ database files.
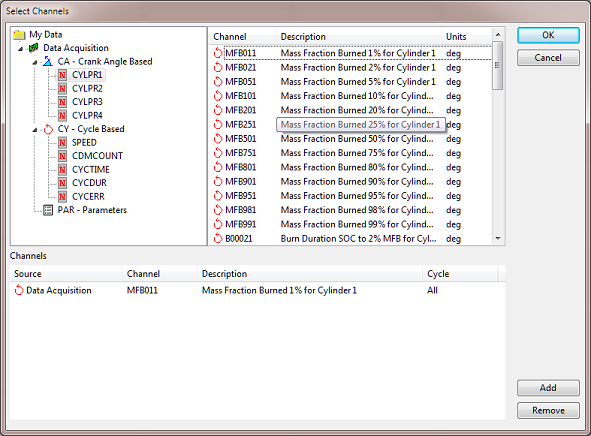
Channel Selection
Selecting data for display or CAN output is simple. Select the raw channel in the tree on the left of the window and a list of analysis channels is displayed for selection.
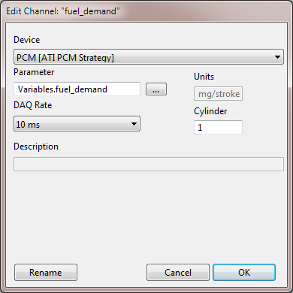
ATI VISION Integration
In addition to crank angle based data acquisition catoolRT can acquire for each combustion cycle PCM parameters via an interface to ATI VISION.
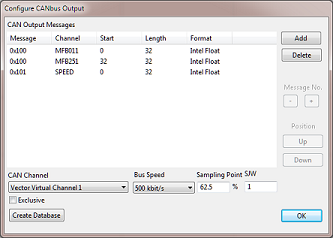
CANbus Output
Any cycle based calculations or their statistic can be broadcast on CANbus using Vector, Kvaser or PEAK hardware. This also includes virtual CAN interfaces that can be logged in other applications such as LabVIEW or ATI VISION.
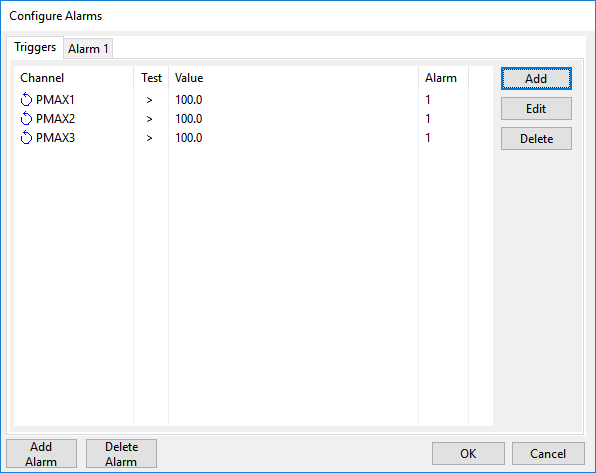
Alarms
Configure alarms to trigger on-screen warning messages, output CAN message and/or trigger digital output
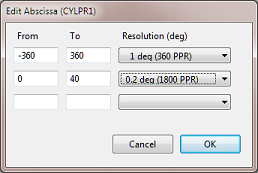
Variable Abscissa
The measurement cycle can be split in up to three resolutions. This enables high resolution analysis during the combustion phase with the benefit of reduced processing and storage requirements.
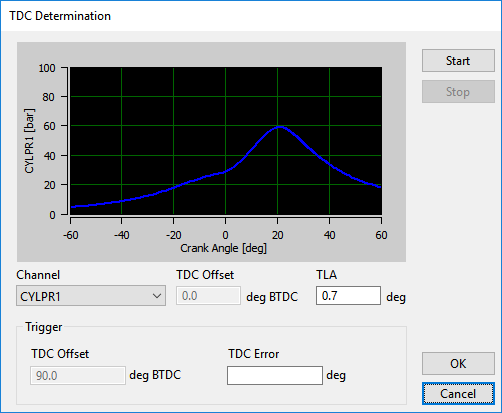
TDC Determination
TDC determination tool during motored non-firing combustion in dyno or fuel off deceleration in-vehicle

Calibration Synchronisation (CalSyncTM)
Log fully time aligned combustion analysis with PCM parameters. Note that cycle calculations are available at the start of the combustion cycle.
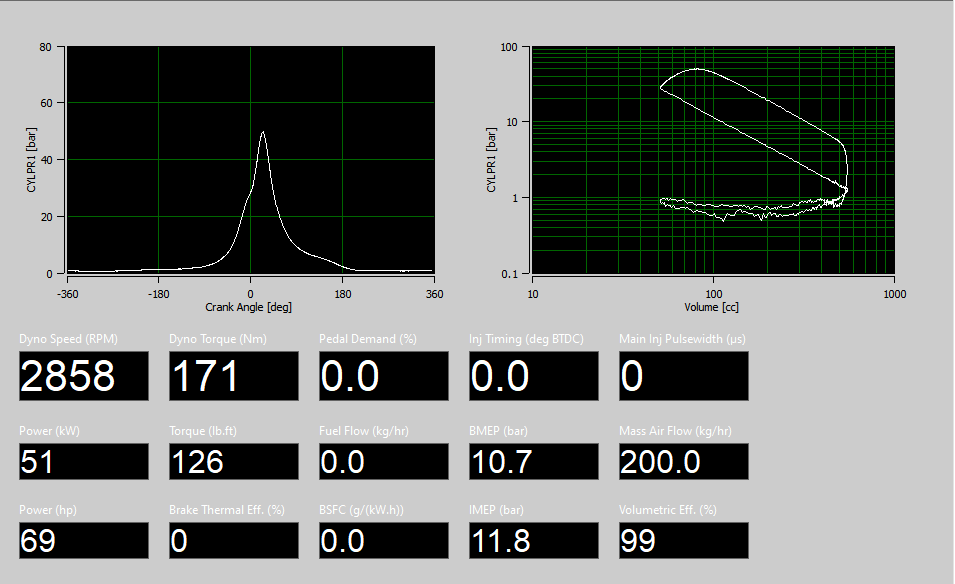
Dyno Interface
Simple display of dyno and PCM information acquired with low speed DAQ of analogue and digital signals and CANbus.
ETAS INCA
Easily display and record combustion parameters in ETAS INCA